See our Colombia issue here. -------------You can view this site in: English | Spanish | Portuguese

Breaking Stories
What's happening in our hemisphere that's important to travelers.


Let's Go Somewhere!
Ideas for travel with creativity and intention.


Calendar of Events
What's coming up in the hemisphere that you might want to see or do.


Travel+Style Articles
Fashion, romance and wellness for travelers seeking confidence and style.

Sugar and Health: The Silent Sweetness That Changes Lives
Apps for Secure LGBTQ+ Travel Across Three Americas

Journeying the Hemisphere with LGBTQ+ Families

Narcissism and Relationships: Impact on Women's Lives

Welcome to Pan America
|
Hello, and welcome to
Ruta Pantera, a digital travel magazine featuring North, Central, and South America. Please take
a look around and check out our TravelDesk, Waypoints, and Experiences -- all reachable at the top and bottom of this page.
To become a member, click here. To find out more About Us,
click here.
|

|
Articles about people, events and society in our hemisphere.

Bad Bunny Makes History with the First Grammy for Album of the Year in Spanish with Debí Tirar Más Fotos
An Intimate and Deeply Puerto Rican Record Conquers Music’s Biggest Night
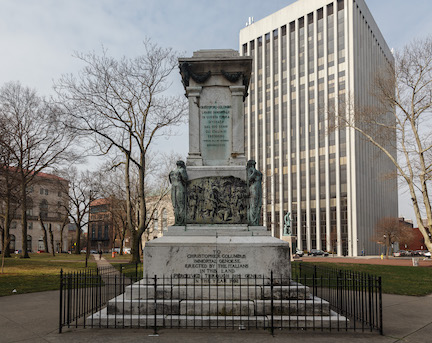
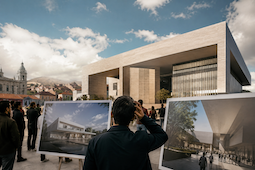
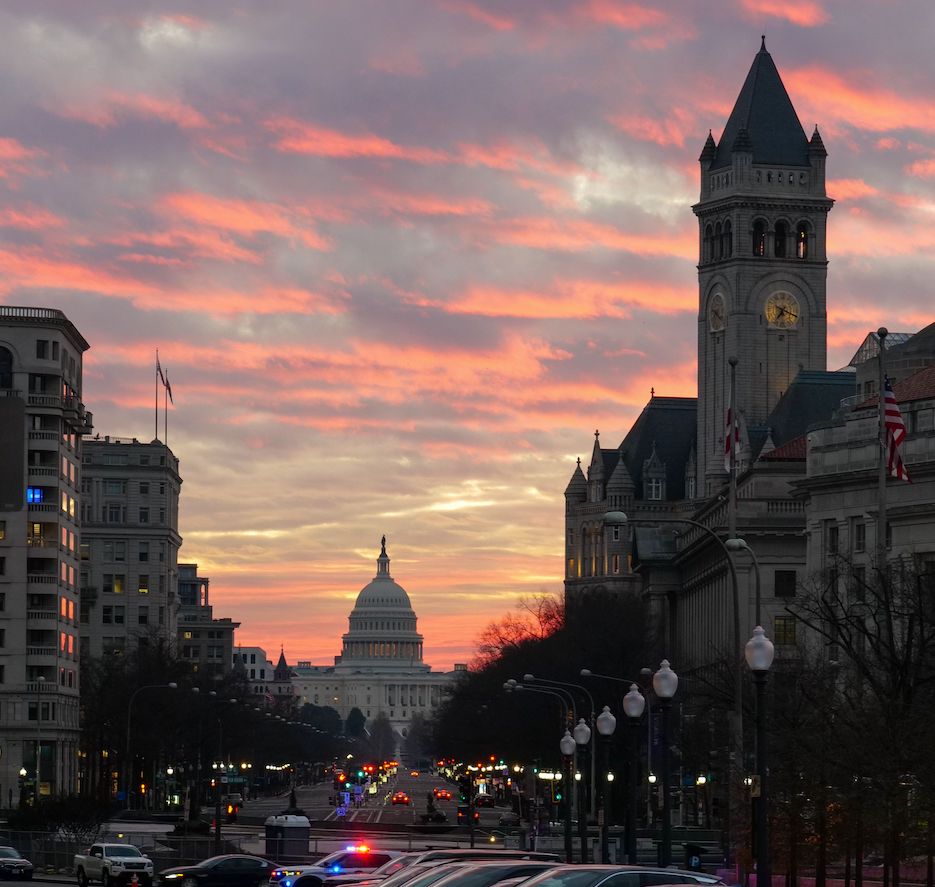
A Lost History Tour: Revisiting the Removed Monuments and Post-Trump Cultural Spaces in the U.S.
How the Destruction of Cultural Monuments Since Trump Have Opened Wounds and Threatened National Memory

A “Trad-Wife” in Latin America
Between Digital Lifestyle and Ideological Discourse

The Original Piñata: The Clay Legacy That Survived the Centuries
A Mexican Tradition that Fuses Ancient Cultures and Resists Modernity
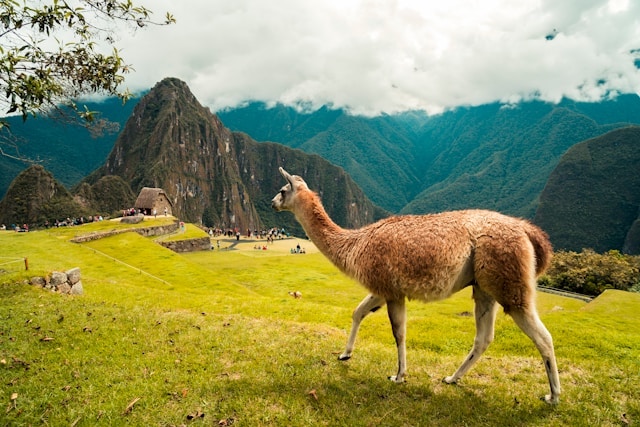
Peruvian Tourism in 2025: Uneven Recovery and Challenges for Machu Picchu
Domestic Market Drives Travel, but Pressure on Machu Picchu Puts the Peruvian Tourism Sector on Alert

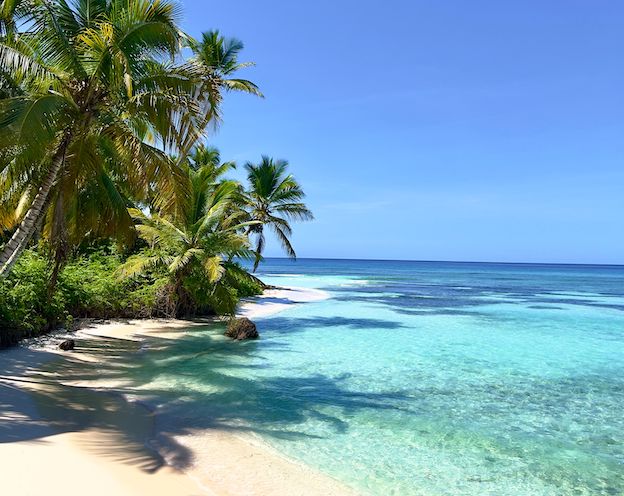
Exploring Panamerica with Pride: A 2025 Guide for the LGBTQ+ Community
A 2025 Guide for the LGBTQ+ Community
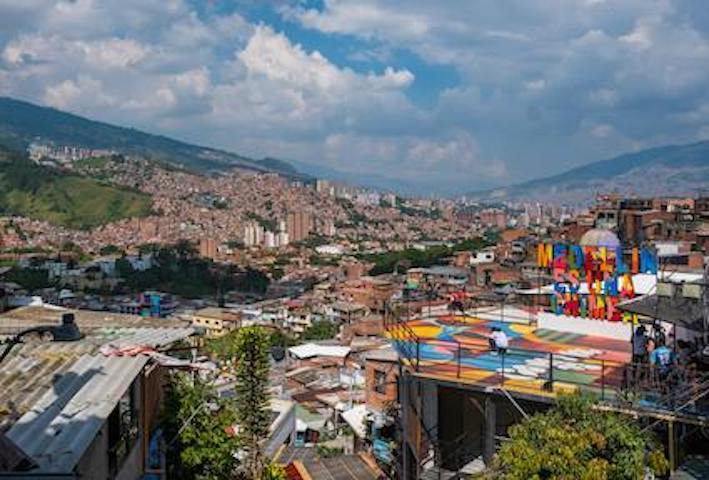
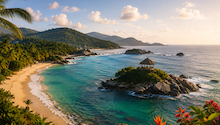
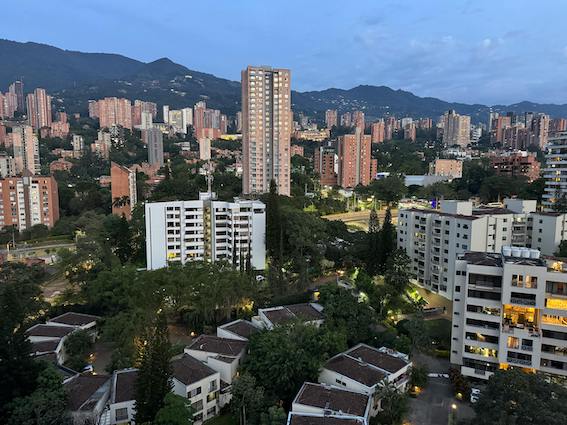
Medellín Consolidates Its Position as Colombia's Tourist Epicenter
The City Now Boasts 33 International Routes To 21 Destinations

Certified Accommodations for LGBTQ+ Travelers
Certifications Such as TAG Approved and Membership in IGLTA offer a Real Promise.
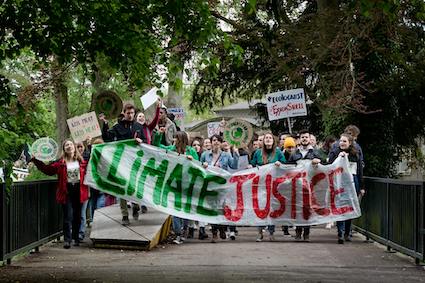
COP30 on the brink of change: climate justice with historic reparations at its core
Enter subtitle

The Planet On the Brink of a “Game Over” Climate Jump
UN Reports World Warming of More than 3°C If Action Is Not Taken
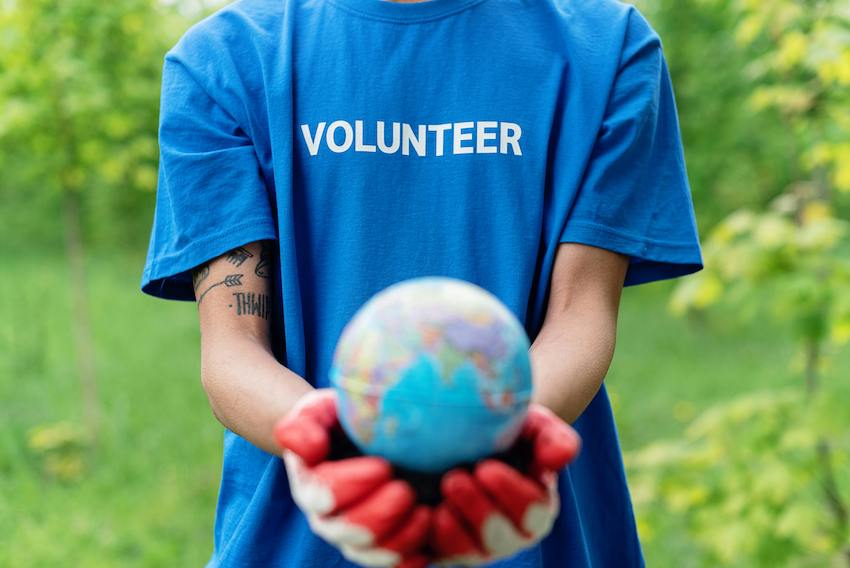
The most effective actions against climate change according to science: what you can do that really makes a difference
A new approach based on scientific evidence reveals that not all personal decisions carry the same weight.

Trump's Climate Gambit: A Blow to Global Cooperation
A Withdrawal that Weakens Humankind’s Response to Global Warming

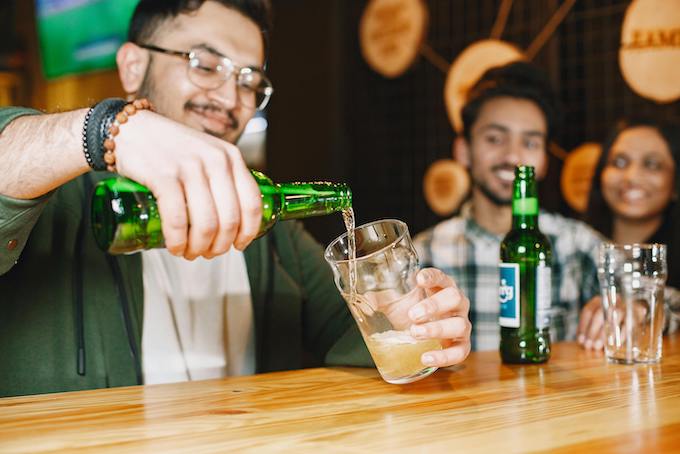
Your Favorite Brew Laid Bare
A Comparison of Popular Beers and Their Ingredients

The Classics that Sweeten the Colombian December
Essential Treats and How To Prepare them for Your Own Celebrations

Mole Poblano
The Sauce that Tells the Story of Mexico

"Crying Isn’t Weakness"
James Dean’s Incredible Legacy in Latin America
The Impact of Colombia's New Presidency on Tourism
How Security and Investment Could Transform this Promising Destination

The Triumph of María Corina Machado with the Nobel Peace Prize
An international recognition of the Venezuelan democratic struggle

The US Reactivates Military Bases in Panama and Puerto Rico
Strategic Return of US Military Installations in Latin America

Trump's Energy Policy Lags In the Face of a Global Renewable Energy Boom
Between America's Fossil Fuel Imperative and the Global Transition To Green


Shakira Redefines the Narrative of Failure
How She Turned a Personal Crisis into Creative Capital and Cultural Dominance

Taylor Swift Regains Control of Her Legacy
The Battle for Her Masters Changes the Rules of the Music Industry
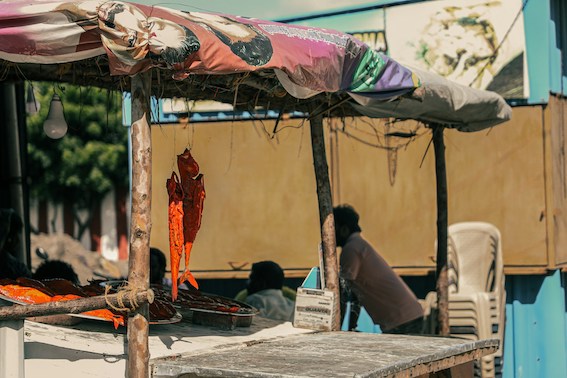
In El Salvador Modernization Means Displacing the Poor
The Social Impacts of Land Privatization, Expropriations, and Tourism Development

Pan-American Sports: From Tech-Enhanced Fashion to Ancestral Games
Fusing Movement with Environmental Consciousness

Bad Bunny as Super Bowl Halftime Headliner
An Obvious Yet Subversive Choice – Everything You Need to Know About This Mega Event

Pedaling To Brazil with Green Intentions
Activists Push for Cleaner Transport in UN Climate Talks

Richest Women in Latin America
How Their Leadership Is Redefining the Region's Business Ecosystem

Boom and Fall of Real Estate in the Sunbelt of the U.S.
Lessons From a Real Estate Bubble Driven by Remote Migration

The World According to Coca-Cola
The Soda That Transformed the Culture, Economy, and Habits of an Entire Continent


Alcohol and Health: The Risks, Benefits and New Guidelines
Exploring Scientific Evidence on Alcohol, Disease, and Current Recommendations

Spirituality as Part of the Remedy for Climate Change?
Reflecting on the Existential Could Help Save Humanity
Leer en Español / Portuguese
The Power of Conscious Touch for Trans and Non-Binary Bodies
Healing Dysphoria Through Affirmative Touch

It’s a Technological Jungle Out There
Drones and AI Revive Brazilian Forests and Curb Deforestation

Companion Robots and Travel: Love, AI, and Airlines?
How Lovense and the Emotional Robots at CES 2026 are Redefining Human Intimacy and the Meaning of Traveling with Artificial Partners

The hidden bill of artificial intelligence
The rise of data centers is driving up electricity demand and putting pressure on the wallets of American households.

Are We Facing an "AI Bubble?"
Powell's Remarks Shake Up the Unequal Economy
The 9 Most Recommended Zones for Expats in Pan-America
Your Urban Guide To Making Informed Decisions Before Settling In a New City.